
Please disable Adblockers and enable JavaScript for domain CEWebS.cs.univie.ac.at! We have NO ADS, but they may interfere with some of our course material.
Visualization
Screencast
Color Coding
Depending on the calculated markings the nodes and edges are visualized with different colors and symbols.
Marking |
Symbol |
Color |
|---|---|---|
New |

|

|
Increased |

|

|
Unchanged |
|
|
Decreased |

|

|
Deleted |

|

|
Design Choices and Functions
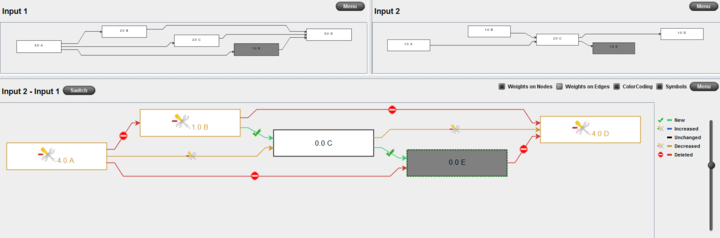
- Graph PositioningThe visualization is set to focus the users attention on the difference graph. The differencegraph is positioned on bottom of the inputs and has 3 times the size of each input.
- Node/Edge PositioningTo support the users mental map nodes and edges are visualized on the same position in each graph.
- LegendA survey showed that only trust intuitive understanding of the different colors/symbols is not an option. Therefore a legend can be accessed to show which color/symbols represents which marking.
- ZoomA zoom function allows faster navigation and gaining a quick overview of the graph.
- HighlightingFor fast comparision why certain nodes are represented with a specific marking the highlighting function allows to select from one to all nodes within the graph and automatically highlight these nodes in the other 2 representations (e.g. Node E)
- SwitchThis button allows to switch the calculation order of the inputs. For example the current state is Input2-Input1 switching changes the order to Input1-Input2.
Visual Properties
Visual properties change how the graphs are visualized. These options can be set on the left side of the menu button.
- Weights on Nodes Visualizes weights in front of the name for each node, within both inputs and the difference graph.
- Weights on Edges Visualizes weights on each edge, within both inputs and the difference graph.
- Color Coding Visualizes the markings with applied color coding. Only within the difference graph.
- Symbols Visualizes the markings with symbols. Only within the difference graph.
User Study
Our evaluation took place with 31 participants and lead to the conclusion that colorcoding and symbols suite the differencegraph best. Details about the results can be found in our paper [currently under review]. Collected data in SAV format can be downloaded here.
Letzte Änderung: 29.06.2015, 13:17 | 352 Worte